Housing market statistics cover data on housing markets but also rents and lettings. There are four main areas of statistics: house price index; other house price information; rents data, and social lettings (CORE).
Publications

Data on council house sales.
Mix-adjusted house prices, a chain linked index and measures of annual inflation.
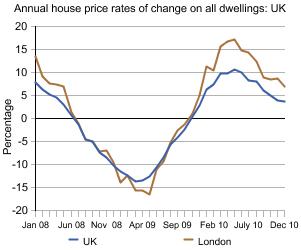
The House Price Index (HPI) is a monthly output based on mortgage completions data from the Regulated Mortgage Survey (RMS). This release contains data on mix-adjusted average house prices and price indices, along with annual rates of change by region, type of buyer and whether a dwelling is new or pre-owned. A seasonally adjusted mix-adjusted house price index and monthly house price change are also included.
The House Price Index (HPI) is a monthly output based on mortgage completions data from the Regulated Mortgage Survey (RMS). This document contains user guidance related to the HPI.

Routine update of housing statistics web tables plus summary of key trends

Presents the results from the Survey of English Housing.

Compendium of housing and planning statistics covering most aspects of housing and planning in England
The Index of Private Housing Rental Prices (IPHRP) is a quarterly experimental price index. It tracks the prices paid for renting property from private landlords in the UK.

The quarterly releases present statistics on possession actions issued in county courts by mortgage lenders and social and private landlords in England and Wales. Note that the figures represent court actions for possession and not actual homes repossessed, as not all possession orders are enforced.
Data on the NewBuy Guarantee Scheme setting out the extent of government's contingent liability under the scheme, government's expenditure to date against claims made under the scheme, and the number of transactions completed under the scheme.

Statistics on housing compiled by Department for Social Development Housing Division and Northern Ireland Housing Executive.
Information on new house sales and prices, actions for mortgage possessions, and new housing starts.
The Residential Property Price Index is a quarterly composite index, combining the Northern Ireland House Price Index with the Northern Ireland Apartment Price Index. It is designed to provide a measure of the change in price of a “typical” residential property sold in Northern Ireland, over the reference period. The index uses information on all residential properties sales each quarter.
The 2010 Private Landlord Survey is a national survey of landlords and managing agents who own and/or manage privately rented properties in England. The aim of the survey is to provide a snap-shot of the composition and experience of landlords and how they (together with any agent) acquire, let, manage and maintain privately rented accommodation.

Presents statistics on the number of right to buy sales of local authority dwellings completed in Wales.

This Statistical Release presents data on all social housing sales in Wales.
Overview
House price index
Department for Communities and Local Government publish a monthly house price index that includes monthly mix-adjusted house prices and annual changes in house prices for the UK and regions. It also includes data on first-time buyers.
Other house price information
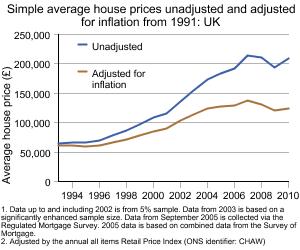
Department for Communities and Local Government publish data on house prices down to local authority level on their website in their live tables from data provided by the Land Registry.
Statistics on repossessions are published by the Ministry of Justice.
Renting data are available for the social sector (properties let by local authorities (LAs) or registered social landlords (RSLs)) and the private sector (properties let by private individuals or companies).
Statistics on rents, lettings and tenancies are included in the Department for Communities and Local Government live tables. These tables use various sources of data including the English Housing Survey, the Housing Subsidy Claims Forms, the Tenant Services Authority's Regulatory and Statistical Return and the Housing Strategy Statistical Appendix.
Social lettings data are available from CORE (the COntinuous REcording of lettings and sales), which records information on the characteristics of both RSLs and local authority new social housing tenants and the homes they rent and buy. Data are collected and published by TNS Research International on the CORE website on behalf of the Department for Communities and Local Government and the Tenant Services Authority. Summary tables are also available on the DCLG live tables.
Technical Data
The Department for Communities and Local Government (DCLG) house price index uses data from the Regulated Mortgage Survey (RMS). The RMS is a survey run by the Council of Mortgage Lenders (CML) that collects data from its members on all their regulated mortgages in the UK.
The Council of Mortgage Lenders (CML) then supplies DCLG with about 60 per cent of the data (as some lenders opt out of submitting the price data). This is then used for the monthly DCLG house price index and other analyses. Further information on the methodology of how the house price index is produced is available on the DCLG website.
The other main source for house price information is the Land Registry. The Land Registry record data on all residential transactions at market value in England and Wales. They then submit this information for use in live tables down to local authority level but also for use in ONS Neighbourhood Statistics down to output area level.
Other data published in the Department for Communities and Local Government live tables includes housing market data collected and published by other government departments, such as repossession court data published by the Ministry of Justice, and other bodies, for example, numbers of actual repossessions published by the Council of Mortgage Lenders.
Rents, lettings and tenancy data comes from a variety of sources:
Lettings information for local authorities is reported in their annual Housing Strategy Statistical Appendix (HSSA) returns. These returns are completed by all local authorities in England and cover a range of topics including sections on lettings, nominations and mobility schemes, waiting lists and choice-based lettings and dwelling stock.
Lettings and rents data for Registered Social Landlords (RSLs) are collected by the Tenant Services Authority's Regulatory and Statistical Returns (RSR). This is an annual data collection whereby every RSL takes part in a census to gather information about, for example:
-
the type and amount of stock they own and manage
-
numbers of lettings
-
rents and service charges
-
number and reasons for vacancies
-
acquisitions
-
sales
Full details and latest analysis from RSR can be found on the RSR Website.
Rents data for local authorities is generated from the Housing Revenue Accounts Subsidy system. Local authorities complete a set of subsidy claims forms annually. This includes a section on rents, whereby local authorities (with their own social housing stock) provide information on their social housing rents in their area.
Information on new social housing lettings made during a year is collected on CORE (Continuous Recording of Lettings and Sales). This measures the ‘flows’ of households entering or transferring in social housing, rather than providing information on every household in social housing.
CORE is currently collected by TNS Research International on behalf of the Department for Communities and Local Government and the Tenant Services Authority. It records information on the characteristics of both registered social landlords (RSLs) and local authority new social housing tenants and the homes they rent and buy. Full details and analysis from CORE can be found at the CORE website.
Data on private market rents are collected in the English Housing Survey, which was formed in April 2008 from integrating the English House Condition Survey with the Survey of English Housing. Full methodology can be found on the Department for Communities and Local Government website.
Glossary
-
Assured and assured shorthold tenancies (private rents)
These tenancy types represent about 75 per cent of all private rented tenancies. The other 25 per cent of tenancy types are generally at lower (non-market) rent levels and include regulated tenancies, employer-provided subsidised accommodation, those with a resident landlord and people living rent–free (for example, in a property owned by a relative). According to the English Housing Survey, in 2009/10 the average rent paid for an assured or assured shorthold tenancy was £160 per week, whilst other tenancy categories had rent levels around £130 per week.
-
First time buyer/former owner occupier
In the statistics presented, a former owner-occupier household is a household that was in owner-occupation immediately prior to making a house purchase. First-time buyers are households that move into owner-occupation without having to sell a property. Therefore, numbers will include some buyers who have previously owned a property before, but are not in owner-occupation at the time of purchase. Estimates suggest that around 20 per cent of stated first-time buyers may fall into this category. The other 80 per cent will be ‘genuine’ first-time buyers (that is, those who have never owned a property before).
-
Income
The income of borrowers is the total recorded income on which the mortgage is based, and it may understate the borrowers’ true income or may include more than one income.
-
Mix-adjusted house prices
The house price index is mix-adjusted to allow for the fact that different houses are sold in different periods. House prices are modelled using a combination of factors that produce a model containing a large number of ‘cells’ (variable combinations such as first-time buyer, old dwelling, and detached property in London). Once the monthly price estimates for all cells have been determined by the model, they are combined with their appropriate weights to produce that month’s mix-adjusted average prices for all the required output categories. Weights are calculated annually based on the relative numbers of transactions during the previous three years. The index is an annual chain-linked Laspeyres-type index, like the Retail Prices Index (RPI).
-
New dwellings
New dwellings are defined as those that never previously existed. So conversions of buildings (for example, out houses, barns) into living accommodation are not counted as ‘new’ dwellings.
-
Repossessions
A property is repossessed if a lender takes it back from a borrower. This can happen when the borrower fails to meet the terms of the contract they signed with the lender when taking out the loan on that property.
Contact Details
For statistical enquiries about this topic, please contact:
Joe Cheung
Email: housing.statistics@communities.gsi.gov.uk
Telephone: +44 (0)303 444 2270
Housing Markets and Planning Analysis division Communities and Local Government Floor 4/H2 Eland House Bressenden Place London SW1E 5DU


