- You are here:
- Home
- > Publications
- > Interpreting Labour Market Statistics
Interpreting Labour Market Statistics


Contents
Abstract
The purpose of this article is to help users of labour market statistics interpret the statistics and highlight some common misunderstandings.
Time periods covered by Labour Force Survey
The Labour Force Survey is a survey of households and is used by the Office for National Statistics to produce estimates for employment, unemployment, economic inactivity, hours worked and redundancies. These figures are published for rolling three month average time periods.
Example:
-
In February 2012, ONS published an unemployment estimate of 2,671,000 for October to December 2011
-
In March 2012, ONS published an unemployment estimate of 2,666,000 for November 2011 to January 2012.
-
In April 2012, ONS published an unemployment estimate of 2,650,000 for December 2011 to February 2012.
-
In May 2012, ONS published an unemployment estimate of 2,625,000 for January to March 2012.
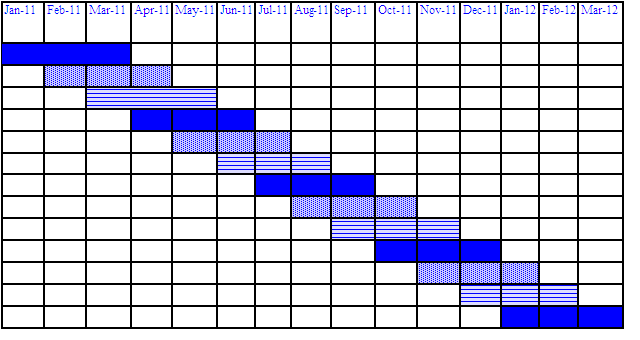
In the May 2012 release, when a figure of 2,625,000 for January to March was published, ONS reported this as being down 45,000 on the "previous quarter". The figure for the previous quarter was 2,671,000 for October to December 2011 published in February 2012, not the figure of 2,650,000 for December 2011 to February 2012 published in April 2012. This is because the Labour Force Survey has been designed to provide comparisons for non-overlapping three month average time periods.
In the diagram below comparisons over time should only be made with the preceding periods of the same colour/shade.
A common misinterpretation is to compare the latest figure with the figure published the previous month, rather than the figure for the previous non-overlapping quarter, published three months earlier.
Labour market statuses
There are three statuses in the labour market; employment, unemployment and economic inactivity. Everybody falls within one of these statuses but nobody can fall within more than one status at the same time. There is a short video explaining these statuses.
Labour market statuses, April to June 2012

Download chart
-
XLS format
(30 Kb)
Employment – Anyone doing one hour or more a week of paid work is counted in the employment figures. This includes people on government supported training programmes if they are engaging in any form of work, work experience or work-related training. The employment estimates also include unpaid family workers, who work in a family business and benefit from the profits of the business although they do not receive a formal wage or salary. People working without pay (for example, volunteers in charity shops) are not included in the employment figures.
Unemployment – People not in employment are counted as unemployed if they have been looking for work in the last four weeks and if they are able to start work within the next two weeks. It does not matter if the person is looking for a full-time job or a part-time job or whether the person is claiming Jobseeker’s Allowance or any other benefits. The unemployment estimates also include people who are out of work, have found a job and are waiting to start it in the next two weeks.
Economically Inactive – Economically inactive people are not in employment but are not counted as unemployed either because they have not been looking for work in the last four weeks or because they are unable to start work within the next two weeks. The economically inactive population includes retired people, those looking after the family or home, those unable to work due to illness or disability and those students who choose not to look for work.A common misunderstanding is to assume that all full-time students are in the economically inactive category. This is incorrect. A full-time student with a part-time job will be recorded in the employment figures. Students who have been looking for a job within the last four weeks and who would be able to start work within the next two weeks would be counted as unemployed, even if they are only looking for part-time work.
Movements in employment, unemployment and economic inactivity show net changes. For example, in August 2012, ONS published estimates showing that there were 201,000 more people in employment in April to June 2012 than in January to March 2012. This does not mean that 201,000 new jobs were created; we do not know how many jobs were created or how many were lost. Increases in the number of people in employment can result from:
-
a person finding a job shortly after their 16th birthday (people younger than 16 are not included in the figures),
-
people moving from unemployment to employment (Example - a jobless person has been successful in applying for a job advertised at a Job Centre),
-
people moving from economic inactivity to employment (Example - a student who was not previously looking for work accepts a part-time job that has been offered),
-
people from other countries entering the UK labour market and finding work (Example - a British worker returning to the UK after a period working abroad).
Rounding
In the Labour Market Statistical Bulletin data tables, estimates of the numbers of people who are employed, unemployed and economically inactive are shown to the nearest 1,000 and the corresponding rates are shown to one decimal place. However, to provide the most accurate estimates of movements over time, changes between time periods are calculated from unrounded figures. This can sometimes mean that the figure shown in the data tables for the changes on quarter may not always exactly equal the difference between the figure for the latest quarter and the figure for the previous quarter.
Example: In Data Table A02 published in June 2012 (1.16 Mb Excel sheet) , ONS published the following information for the headline economic inactivity rate for those aged from 16 to 64:
- the figure for February to April 2012 (the latest quarter) was 23.0 per cent,
- the figure for November 2011 to January 2012 (the previous quarter) was 23.1 per cent,
-
the change on quarter was minus 0.2 percentage points.
When rounded to two decimal places, the figure for February to April 2012 was 22.96 per cent and the figure for November 2011 to January 2012 was 23.14 per cent:
-
22.96 minus 23.14 equals minus 0.18 (which shows as minus 0.2 percentage points when rounded to one decimal place).
Unemployment and the claimant count
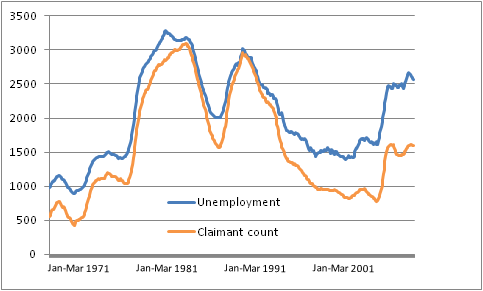
The unemployment estimates are sometimes confused with the claimant count estimates. The two series measure different, although similiar, concepts.
A common misinterpretation is to report that the unemployment figures are a count of benefit claimants and that unemployed people not claiming benefits are excluded from the figures. This is incorrect. Unemployment is measured according to international guidelines specified by the International Labour Organisation (ILO). Unemployed people in the UK are:
-
without a job, have actively sought work in the last four weeks and are available to start work in the next two weeks or,
-
out of work, have found a job and are waiting to start it in the next two weeks.
People who meet these criteria are classified as unemployed irrespective of whether or not they claim Jobseeker’s Allowance or other benefits. The estimates are derived from the Labour Force Survey and are published for three month average time periods.
The claimant count measures the number of people claiming unemployment-related benefits; since October 1996 this has been the number of people claiming Jobseeker’s Allowance (JSA). Some JSA claimants will not be classified as unemployed. For example, people in employment working less than 16 hours a week can be eligible to claim JSA depending on their income.
Unemployment and the claimant count 1971 to 2012, thousands of people, seasonally adjusted

Download chart
-
XLS format
(89 Kb)
Unemployment estimates follow international guidelines and can therefore be compared with unemployment estimates for other countries. This is not the case with the claimant count as unemployment benefit systems vary between different countries. The claimant count can be affected by changes to the overall benefits system such as:
-
fewer lone parents being able to claim Lone Parent Income Support due to changes in the rules,
-
some people losing their entitlement to Incapacity Benefit,
-
the introduction of the Work Programme in June 2011 has resulted in individuals being more likely to remain on JSA for a single unbroken duration, rather than a series of shorter duration claims as was the case with previous employment initiatives.
One of the strengths of the claimant count is that it provides more reliable estimates than unemployment for local areas. This is because the claimant count is sourced from records of the number of people claiming JSA, but the unemployment estimates are sourced from a survey which is less reliable at local area level than for the UK as a whole.
Calculation of unemployment rate
The unemployment rate is not the proportion of the total population who are unemployed. It is the proportion of the economically active population (those in employment plus those who are unemployed) who are unemployed. This follows international guidelines specified by the International Labour Organisation and it ensures that unemployment rates published by ONS are comparable with those published by other countries.
Example: In August 2012, ONS published an unemployment rate of 21.5 per cent for April to June 2012 for people aged from 16 to 24. This does not mean that over one in five young people were unemployed as shown below:
-
Employed 3,690,000,
-
Unemployed 1,012,000.
-
Economically Active 4,702,000 (Employed plus Unemployed),
-
Economically Inactive 2,575,000,
-
Total 7,276,000 (Active plus Inactive).
The figures above do not sum exactly due to rounding. The rate of 21.5 per cent is the number of unemployed people (1,012,000) as a percentage of the economically active population (4,702,000), not as a percentage of the total population (7,276,000). In this example, an unemployment rate of 21.5 per cent reflects less than 1 in 7 people aged from 16 to 24 being unemployed.
Employment and jobs
Employment and jobs are different concepts as some people have more than one job. Estimates of employment measure the number of people in employment, so a person with more than one job would be counted once in the employment estimates.
The employment estimates are published every month and the information comes from the Labour Force Survey – a survey of households. The jobs estimates are published four times a year (in March, June, September and December) and are mainly sourced from surveys of employers.
Employment and jobs, seasonally adjusted

Download chart
-
XLS format
(30.5 Kb)
At whole economy level, employment estimates derived from surveys of individuals are more comprehensive than jobs estimates derived from surveys of businesses. However the jobs estimates provide a better quality industrial breakdown than the employment estimates.
This is because the industrial breakdown of the employment estimates are based on what people completing the Labour Force Survey questionnaire tell the interviewers, and people’s perceptions do not always match the official classification scheme.
Movements over time in both the employment and jobs figures measure net changes . For example, in June 2012 ONS published estimates showing that the number of jobs in the manufacturing sector increased by 38,000 between December 2011 and March 2012.
This does not mean that 38,000 manufacturing jobs were created. We do not know how many jobs were created and how many were lost; only that there were 38,000 more jobs in the manufacturing sector in March 2012 than there were in December 2011.
A common misinterpretation is to report that the estimates show how many jobs have been created or how many job losses have occurred. ONS does not produce any estimates for job creation or job losses.
Non-UK workers in the labour market
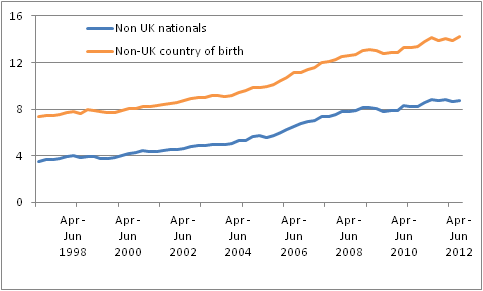
ONS publishes estimates of the number of people in employment broken down by both country of birth and by nationality. These estimates are derived from the Labour Force Survey and, as with all employment figures derived from the LFS, the figures measure net changes.
The non-UK born series measures all people in employment who were not born in the UK , irrespective of whether or not they are British nationals or of how long they have lived in the UK. The non-UK nationals series measures all people in employment who state that their main nationality is not British. The non-UK born series (4.2 million in April to June 2012) is much higher than the non-UK nationals series (2.6 million in April to June 2012) because the non-UK born series includes many British nationals who were born abroad.
A common misinterpretation is to report that the estimates show the proportion of new jobs taken by foreigners. The estimates relate to the number of people in employment, not the number of jobs, and movements over time measure net changes.
Non-UK nationals and Non-UK born people in employment as a percentage of all people in employment, not seasonally adjusted

Download chart
-
XLS format
(43.5 Kb)
Earnings
ONS publishes estimates of Average Weekly Earnings every month. A common misinterpretation is to report these estimates as being purely a measure of pay settlements and bonuses. The estimates also reflect changes in the number of hours worked and the effect of changes in the structure of the workforce.
For example, fewer low paid jobs in the economy would have an upward effect on the earnings growth rate. Despite its name, the percentage growth figures from the Average Weekly Earnings series are annual; its name refers to the fact that the series also produces a cash figure for average weekly pay.
Movements in growth rates can sometimes be affected by employers moving from one category to another. For example, the estimates for June 2012, published in August 2012, showed an increase in the public sector single month growth rates.
This increase was not caused by higher pay settlements in the public sector; it was caused primarily by people employed by some educational bodies moving from the public sector to the private sector. As the earnings of these people were lower than the public sector average, the reclassification resulted in an increase in public sector earnings growth rates and a smaller fall in private sector earnings growth rates.
Background notes
-
Enquiries relating to labour market statistics should be directed to Richard Clegg, Labour Market Division, Office for National Statistics.
Phone: +44 (0)1633 455400
Email: labour.market@ons.gsi.gov.uk
-
Details of the policy governing the release of new data are available by visiting www.statisticsauthority.gov.uk/assessment/code-of-practice/index.html or from the Media Relations Office email: media.relations@ons.gsi.gov.uk
© Crown Copyright applies unless otherwise stated.


