Guidance for Time Series tables
Main Content
What are time series?
A time series is a collection of data representing the same thing measured at different times. This gives insight into changes over time. For example, you may wish to see how GCSE results have changed over time in your area.
Using time series in Neighbourhood Statistics
In Neighbourhood Statistics there are a number of datasets where data are available for several points in time. In such cases there are a number of specific time series functions that can be used to help interpret the information. These functions are called 'rate of change' and 're-base'.
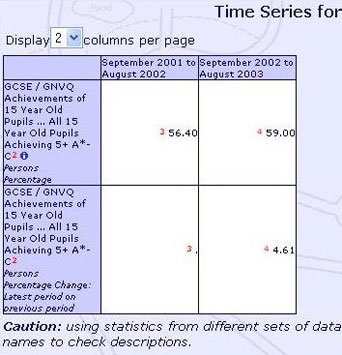
The rate of change function allows you to calculate the percentage change between data for two points in time. So if, for example, you looked at the percentage of 15 year olds achieving 5+ GSCEs A* - C in 2001/2 and 2002/3, this option would calculate the percentage change between 2001/2 and 2002/3, as shown below for Fareham local authority district.

The re-base option allows you to obtain a time series which shows how the data have changed compared with a point in time of your choice - the 'base year'.
A useful application of this option may be where you wish to compare how the number of Income Support claimants in a ward has changed since a particular point in time, compared with the equivalent change in the local authority and region. As the numbers involved at the different geographical levels are of very different sizes, to simply draw a line graph would mean that the line for the ward would be overwhelmed by that for the region:

The re-base option, however, sets the value of the base year to 100 for all geographies, allowing you to compare the different levels directly.

Information on using the Neighbourhood Statistics time series functions is available in the Customised Tables, Charts and Maps section of the User Guide.
Important things to remember when using time series
In Neighbourhood Statistics it is only possible to carry out time series functions on data where the data variable and the geographical area are identical for each time period. So if there has been a change in the definition of a particular data variable between two years, then the time series for this variable would not be displayed. The time series would also not be permitted if the data for the different years relate to different geographical hierarchies (eg 1998 Wards and 2003 Wards).
Changes over time can be caused by a number of factors, so if you are trying to establish the impact of a particular project on, say, unemployment, and there has been a reduction in the unemployment rate in your area over the period since the project was implemented, you should also consider other factors that may have had an influence.
