Official Statistics
Driver and rider testing and instructor statistics: October to December 2014
Statistics on the number of practical driver and rider tests undertaken as well as approved driving instructor statistics in Great Britain.
Documents

Detail
Information on the number and pass rates of driving and riding practical tests conducted in Great Britain for the quarter to 31 December 2014, and also statistics on driving instructors. The statistics are derived from data held by the Driver and Vehicle Standards Agency (DVSA), which administers the driving test and training schemes in Great Britain.
During the latest quarter (October to December 2014):
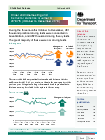
- there were 415,849 car theory tests, 6.5% more than in the same quarter of the previous year. The pass rate for these tests was 50.1%, 0.4 percentage points lower than in the same period of 2013.
- there were 393,025 car practical tests, 3.1% more than in the same quarter of the previous year. The pass rate for these tests was 46.6%, unchanged from the same period in 2013.
- the number of motorcycle theory tests was 16.5% up compared with the same period of the previous year. The number of motorcycle practical tests was 11.3% up for module 1 and 13.1% up for module 2 compared with same period of the previous year.
- increasing numbers of theory and practical LGV tests conducted in the latest three quarters suggest growth in this sector at a time of GDP growth.
Contact us
Driving tests and instructors statistics enquiries
Email vehicles.stats@dft.gsi.gov.uk
Public enquiries 020 7944 4139