Official Statistics
Driver and rider testing and instructor statistics: July to September 2015
Statistics on the number of practical driver and rider tests undertaken as well as approved driving instructor statistics in Great Britain.
Documents

Detail
Information on the number and pass rates of driving and riding practical tests conducted in Great Britain for the quarter July to September 2015, and also statistics on driving instructors.
The statistics are derived from data held by the Driver and Vehicle Standards Agency (DVSA), which administers the driving test and training schemes in Great Britain.
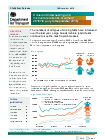
During July to September 2015:
- the total numbers of driving theory and practical tests both increased over the last year, by 17% and 5% respectively. In the last quarter, 444,000 practical and 572,000 theory tests were conducted, almost 90% being car tests
- the most rapid increases were again for Large Goods Vehicle (LGV) tests, up 34% overall, reflecting the improving economy and current high demand for professional lorry drivers
Contact us
Driving tests and instructors statistics
Email vehicles.stats@dft.gsi.gov.uk
Public enquiries 020 7944 4139