National Statistics
Port freight statistics: 2016 final figures

- From:
- Department for Transport
- Part of:
- Maritime and shipping statistics, Maritime sector, Individual port traffic (PORT04), Port freight (PORT02), Key port statistics (PORT03), UK ship arrivals (PORT06), and UK ports and traffic (PORT01)
- Published:
- 1 September 2017
- Last updated:
- 1 September 2017, see all updates
Final figures on UK port traffic for 2016.
Documents

Port freight statistics: 2016 final figures report
PDF, 5.95MB, 30 pages

Port freight statistics: 2016 final figures tables
ZIP, 8.07MB
This file may not be suitable for users of assistive technology. Request an accessible format.
If you use assistive technology (such as a screen reader) and need a version of this document in a more accessible format, please email webmasterdft@dft.gsi.gov.uk. Please tell us what format you need. It will help us if you say what assistive technology you use.
Port freight statistics: 2016 factsheet
PDF, 504KB, 1 page

Index sheet of port freight statistics tables
ODS, 6.81KB
This file is in an OpenDocument format
This file may not be suitable for users of assistive technology. Request an accessible format.
If you use assistive technology (such as a screen reader) and need a version of this document in a more accessible format, please email webmasterdft@dft.gsi.gov.uk. Please tell us what format you need. It will help us if you say what assistive technology you use.
Details
Statistics on port traffic in the United Kingdom.
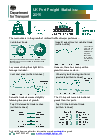
In 2016:
- total tonnage decreased by 3% to 484.0 million tonnes
- coal handled showed the biggest decline of any cargo category more than halving to 12.0 million tonnes
- liquid bulk goods, which account for 40% of total tonnage, decreased by 2%
- crude oil handled has halved since 2000, to 87.1 million tonnes
- unitised traffic rose by 2% to 24.1 million units
- container units reached a record high of 5.9 million units
- overall roll-on roll-off traffic rose 1.4% to 18.2 million units
- the volume of import and export motor vehicles increased 1% to 4.5 million units
User engagement exercise: results
Last year, users of these statistics were asked for feedback via a short online survey. A summary of the responses received was published in March 2017.
The department continually reviews the coverage and methodology of the port freight statistics, to ensure they remain useful. Any further feedback is welcome and can be provided via email to maritime statistics.
We will keep users of the statistics informed of any further changes, and aim to provide an update alongside the next quarterly release in December.
Contact us
Maritime and shipping statistics
Email maritime.stats@dft.gsi.gov.uk
Domestic waterborne freight enquiries 020 7944 2403
Seafarers statistics enquiries 020 7944 2403
Shipping statistics enquiries 020 7944 4119
Sea passengers statistics enquiries 020 7944 4163
Ports statistics enquiries 020 7944 4163
Document information
Published: 1 September 2017
Updated: 1 September 2017
- Replaced table port0303 to correct a minor error in the original.
- First published.