Official Statistics
Weekly all-cause mortality surveillance: 2018 to 2019
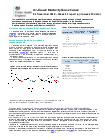
How the actual number and type of death registrations in England and Wales compare to predictions for each week.
Documents


Details
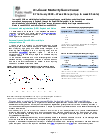
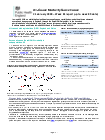
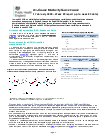
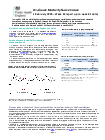
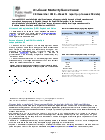
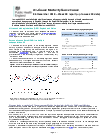
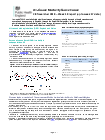
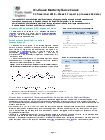
Public Health England’s (PHE’s) weekly all-cause mortality surveillance helps to detect and report significant weekly excess mortality (deaths) above normal seasonal levels. This report doesn’t assess general trends in death rates or link excess death figures to particular factors.
Excess mortality is defined as a significant number of deaths reported over that expected for a given week in the year, allowing for weekly variation in the number of deaths. PHE investigates any spikes seen which may inform public health actions.
Reports are published weekly in the winter season (October to May) and fortnightly during the summer months (June to September).
This page includes reports published from 11 October 2018 to the present.
Reports are also available for:
Published 11 October 2018
Last updated 7 February 2019 + show all updates
Last updated 7 February 2019 + show all updates
- Added report for week 6 2019, with data up to week 5 2019.
- Added report for week 5 2019, with data up to week 4 2019.
- Added report for week 4 2019, with data up to week 3 2019.
- Added report for week 3 2019, with data up to week 2 2019.
- Added report for week 2 2019, with data up to week 1 2019.
- Added report for week 51, 2018 with data up to week 50.
- Added report for week 50, 2018 with data up to week 49.
- Added report for week 49, 2018 with data up to week 48.
- Added report for week 48, 2018 with data up to week 47.
- Added report for week 47, 2018 with data up to week 46.
- Added report for week 46, 2018 with data up to week 45.
- Added report for week 45, 2018 with data up to week 44.
- Added report for week 44, 2018 with data up to week 43.
- Added report for week 43, 2018 with data up to week 42.
- Added report for week 42, 2018 with data up to week 41.
- First published.