Rural Economic Bulletin for England, September 2021
Updated 4 October 2021

© Crown copyright 2021
This publication is licensed under the terms of the Open Government Licence v3.0 except where otherwise stated. To view this licence, visit nationalarchives.gov.uk/doc/open-government-licence/version/3 or write to the Information Policy Team, The National Archives, Kew, London TW9 4DU, or email: psi@nationalarchives.gov.uk.
Where we have identified any third party copyright information you will need to obtain permission from the copyright holders concerned.
This publication is available at https://www.gov.uk/government/statistics/quarterly-rural-economic-bulletin/rural-economic-bulletin-for-england-september-2021
This is a regular quarterly bulletin and covers periods prior to the Covid-19 outbreak. However additional analysis has been included where possible to show some impacts of the outbreak. Some additional contextual information on the rural economy and poverty in rural areas has been also included.
In England, 9.6 million people (17% of the population) live in rural areas; 46.7 million (83%) live in urban areas.
Presented below are the most current data available for a selection of economic indicators for rural and urban areas that are released on a quarterly basis. Timescales are different across the various datasets.
The table below compares the most recent quarter to the previous quarter.
Later sections present annual comparisons for the most recent quarter.
| Quarterly change | Rural | Urban |
|---|---|---|
| House prices (average sale price) year ending Q3 2020 to year ending Q4 2020 |
£358,800 ▲ 3.6% |
£324,400 ▲ 2.4% |
| Percentage unemployed (aged 16 and over seeking work) Q1 2021 to Q2 2021 |
2.9% ◄► by 0.0% |
4.9% ▼ by 0.4% |
| Claimant count (percentage of working age population on Jobseeker’s Allowance) Q1 2021 to Q2 2021 |
0.3% ▼ by 0.2% |
0.5% ▼ by 0.2% |
| Redundancies (per 1000 workers) Q1 2021 to Q2 2021 |
2.3 ▼ from 5.0 |
3.9 ▼ from 6.1 |
Table notes:
All changes are based on unrounded figures and therefore may not agree exactly to the figures presented in the text and tables which are rounded to 1 decimal place.
1. House prices
This section was not updated as publication of Q1 2021 house price data has been delayed to 9th November.
The average house sale price increased by 6.2% in rural areas and 4.7% in urban areas excluding London between year ending Q4 2019 and year ending Q4 2020
Average prices in rural areas have been consistently above the average found in urban areas excluding London (by 39% in year ending Q4 2020) and higher than urban areas overall (by 11% for the same period).
In year ending Q4 2020 average house prices in rural town and fringe areas were 24% higher than the average found in urban areas excluding London (but 1% lower than urban overall), while average house prices in rural village and hamlet areas
Annual average sale price of houses: Q4 2019 to Q4 20201
| Category | Year ending Q4 2019 | Year ending Q4 2020 | Annual change1 |
|---|---|---|---|
| Rural2</sup | £337,700 | £358,800 | 6.2%▲ |
| of which Rural town & fringe2 | £304,400 | £319,600 | 5.0%▲ |
| of which Rural village & hamlet | £372,400 | £399,600 | 7.3%▲ |
| Urban | £309,500 | £324,400 | 4.8%▲ |
| of which Urban (excl London) | £246,600 | £258,300 | 4.7%▲ |
| of which London2 | £605,200 | £635,400 | 5.0%◄► |
| England | £314,400 | £330,500 | 5.1%▲ |
Table notes
Source: ONS small area house price statistics
(1) Change is calculated using unrounded figures whereas prices are shown rounded to the nearest £100.
(2) There are a total of 983 London MSOAs, all of which are classified as urban except for one which is classified as rural town and fringe and is excluded from the rural figures.
Annual average sale price of houses (£ thousands), year ending Q1 2007 to year ending Q4 2020

Average house prices (£ thousands), Q1 2007 to Q4 2020
Chart notes
Source: ONS house price statistics for small areas
2. Economic activity
Rural employment is now shown as a percentage of people aged 16 to 64 in line with other standard indicators of employment. It decreased by 0.8 percentage points, and was 2.4 percentage points above urban areas in Q2 2021.
Unemployment (as a percentage of those aged 16 and over) decreased by 0.4 percentage points in rural areas and was 2.0 percentage points below urban areas in Q2 2021.
The inactivity rate (not in employment or unemployed) in rural areas increased by 0.3 percentage points, and was 4.1 percentage points lower in urban areas.
Within inactivity, the retirement rate fell slightly in rural and increased in urban areas.
Percentage of people economically active and inactive: Q2 2020 to Q2 20211
| Status | Rural2 Q2 2020 | Rural 2 Q2 2021 | Urban2 Q2 2020 | Urban2Q2 2021 |
|---|---|---|---|---|
| Employed3 | 78.0 | 77.2 ▼ | 75.6 | 74.8 ▼ |
| Unemployed4 | 3.3 | 2.9 ▼ | 4.2 | 4.9 ▲ |
| Inactive | 39.6 | 40.0 ▲ | 35.4 | 35.9 ▲ |
| of which Inactive retired | 28.5 | 28.2 ▼ | 19.8 | 20.3 ▲ |
Table notes:
Source: ONS (Labour Force Survey, not seasonally adjusted).
(1) All changes are based on unrounded figures and therefore may not agree exactly to the figures presented in the text and tables which are rounded to 1 decimal place.
(2) According to the Rural-Urban Classification 2011.
(3) As a percentage of people aged 16 to 64 bringing this figure in line with other publications where employment rate is shown as percentage of people aged 16 to 64.
(4) As a percentage of people aged 16 and over who are economically active (in or seeking work).
Percentage employed, Q1 2007 to Q2 2021

Percentage employed, Q1 2007 to Q2 2021
Chart notes:
Source: ONS (Labour Force Survey).
Dashed line: 2001 Rural-Urban Classification (RUC) applied up to Q4 2013; 2011 RUC applied from Q1 2014; some areas may have changed category between RUC versions.
3. Claimant count
Between Q2 2020 and Q2 2021, the percentage of the working age population claiming Jobseeker’s Allowance decreased by 0.2 percentage points in rural areas and 0.2 percentage point in urban areas.
Jobseeker’s allowance claimants as a percentage of the working age population:
Q2 2020 to Q2 2021
| Category1 | Q2 2020Claimants | Q2 2020Per cent2 | Q2 2021Claimants | Q2 2021Per cent2 | Annual percentagepoint change |
|---|---|---|---|---|---|
| Rural | 27,400 | 0.5 | 18,200 | 0.3 | 0.2 ▼ |
| of which Rural town & fringe | 16,400 | 0.5 | 10,900 | 0.4 | 0.2 ▼ |
| of which Rural village & hamlet | 10,900 | 0.4 | 7,300 | 0.3 | 0.1 ▼ |
| Urban | 217,100 | 0.7 | 158,800 | 0.5 | 0.2 ▼ |
| England | 244,500 | 0.7 | 177,000 | 0.5 | 0.2 ▼ |
Table notes:
Source: ONS Jobseeker’s Allowance data (via Nomis) and Defra..
Does not include people claiming Universal Credit.
(1) Using the Lower-Layer Super Output Area classification 2011.
(2) The number of claimants of Jobseeker’s Allowance as a percentage of the working age population.
Claimants of Jobseeker’s Allowance as a percentage of the working age population, Q1 2007 to Q2 2021
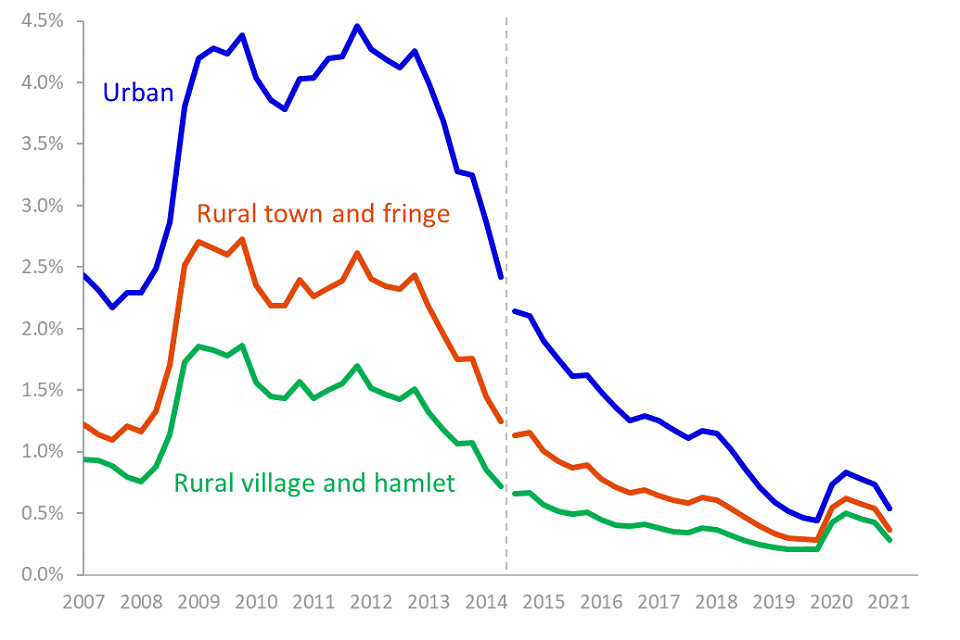
Claimants of Jobseeker’s Allowance as a percentage of the working age population, Q1 2007 to Q2 2021
Chart notes
Sources: ONS Jobseeker’s Allowance data (via Nomis) and Defra.
Does not include people claiming Universal Credit.
For further information please see the article Jobseeker’s Allowance, Universal Credit and the Claimant Count Changes to the Measurement of the Claimant Count
Dashed line: 2001 Lower-Layer Super Output Area (LSOA) classification applied up to Q2 2014; 2011 LSOA classification from Q3 2014.
4. Claimant count, monthly data to August 2021
This section covers the COVID-19 outbreak.
Between July 2021 and August 2021 there has been a decrease in people claiming Universal Credit or Job Seeker’s Allowance whilst seeking work.
In August 2021, 241,175 people living in predominantly rural areas (3.5 per cent of the working age population) claimed Universal Credit or Job Seeker’s Allowance whilst seeking work, compared with 1,447690 people living in urban areas (6.1 per cent of the working age population).
Between July 2021 and August 2021 the number of people claiming Universal Credit or Job Seeker’s Allowance decreased by 4.3 per cent in predominantly rural areas compared with a decrease of 3.6 per cent in predominantly urban areas.
Percentage of the working age population claiming Universal Credit or Job Seeker’s Allowance whilst being required to search for work by Local Authority Classification, in England, Jan 2020 – August 2021

Percentage of the working age population claiming Universal Credit or Job Seeker’s Allowance whilst being required to search for work by Local Authority Classification, in England, Jan 2020 – Aug 2021
| Category | Sep 2020 | Oct 2020 | Nov 2020 | Dec 2020 | Jan 2021 | Feb 2021 | Mar 2021 | Apr 2021 | May 2021 | Jun 2021 | Jul 2021 | Aug 2021 |
|---|---|---|---|---|---|---|---|---|---|---|---|---|
| Predominantly rural | 4.8% | 4.5% | 4.6% | 4.5% | 4.4% | 4.7% | 4.7% | 4.6% | 4.2% | 3.8% | 3.7% | 3.5% |
| Urban with significant rural | 5.2% | 4.9% | 4.9% | 4.9% | 4.8% | 5.0% | 5.0% | 4.9% | 4.6% | 4.2% | 4.1% | 3.9% |
| Predominantly urban | 7.3% | 7.1% | 7.2% | 7.2% | 7.1% | 7.4% | 7.4% | 7.3% | 7.0% | 6.5% | 6.3% | 6.1% |
| England | 6.6% | 6.3% | 6.4% | 6.4% | 6.3% | 6.6% | 6.6% | 6.5% | 6.1% | 5.7% | 5.5% | 5.3% |
Chart notes
Source: ONS Claimant Count data using data from Jobcentre Plus administrative system, ONS mid-year population statistics.
Notes: These data are experimental and consist of claimants of Job Seekers Allowance (JSA) and some Universal Credit (UC) claimants. The UC claimants that are included are those who are required to search for work (i.e. within the Searching for Work conditionality regime as defined by the Department for Work & Pensions).
5. Redundancies
In Q2 2021 9,000 people living in rural areas were made redundant, 5,000 less than a year earlier in Q2 2020.
The redundancy rate in rural areas decreased from 3.5 to 2.3 redundancies per 1,000 workers between Q2 2020 and Q2 2021, in urban areas the rate decreased from 5.4 to 3.9 redundancies per 1,000 workers.
Count of redundancies and rates1 per 1000 workers
| Category2 | Q2 2020Count | Q2 2020Rate1 | Q2 2021Count | Q2 2021Rate1 |
|---|---|---|---|---|
| Rural | 14,000 | 3.5 | 9,000 | 2.3 |
| Urban | 106,000 | 5.4 | 77,000 | 3.9 |
| England | 120,000 | 5.1 | 86,000 | 3.7 |
Table notes:
Source: ONS (Labour Force Survey).
(1) Ratio of the number of workers (aged 16 and over) made redundant for the given quarter to the number of employees (aged 16 and over) in the previous quarter multiplied by 1000, based on location of residence.
(2) 2001 Rural-Urban Classification (RUC) applied up to Q3 2015, 2011 RUC from Q4 2015.
Count of redundancies and rates1 per 1000 workers, split by sector, Q2 2021
| Sector | Rural2Count | Rural2Rate1 | Urban2Count | Urban2Rate1 |
|---|---|---|---|---|
| Agriculture, fishing, energy & water | * | * | * | * |
| Manufacturing industries | * | * | 15,000 | 7.8 |
| Construction | * | * | 2,000 | 1.8 |
| Distribution, hotels and restaurants | 2,000 | 2.9 | 14,000 | 4.3 |
| Transport and communication | * | * | 6,000 | 5.3 |
| Finance and business services | 2,000 | 3.6 | 23,000 | 5.5 |
| Education, health and public admin | 2,000 | 1.8 | 11,000 | 1.7 |
| Other services | * | * | * | * |
| All industries | 9,000 | 2.3 | 77,000 | 3.9 |
Table notes:
Source: ONS (Labour Force Survey).
(1) Ratio of the number of workers (aged 16 and over) made redundant for the given quarter to the number of employees in the previous quarter multiplied by 1000, based on location of residence rather than workplace.
(2) According to the Rural-Urban Classification 2011.
(*) Data suppressed to prevent disclosure.
(-) Count value less than 1000
Redundancies per 1000 employees, Q1 2007 to Q2 2021

Redundancies per 1000 employees, Q1 2007 to Q2 2021
Chart notes:
Source: ONS (Labour Force Survey).
Dashed line: 2001 Rural-Urban Classification (RUC) applied up to Q3 2015, 2011 RUC from Q4 2015.
6. Covid-19 business support grants
Latest available data.
A range of support grants have targeted SME businesses that have been impacted by national and local restrictions. As of April 2021, predominantly rural local authorities have been more effective at distributing grant payments. They have reportedly distributed:
-
643,000 grants with a value of £1,420m from the Local Restrictions Support Grant to businesses hampered by local restrictions.
-
139,000 grants with a value of £370m from the Additional Restrictions Grant to businesses hampered by national restrictions.
-
121,000 grants with a value of £910m from the Restart Grant to assist businesses reopening after restrictions are lifted.
7. Covid-19 furlough scheme
Latest available data.
The Coronavirus Job Retention Scheme (furlough scheme), allows businesses to place workers on temporary leave and covers 80% of the employees’ wages, up to £2,500 / month.
As of the 31st July, 223,000 employments in predominantly rural areas and 918,000 employments in predominantly urban areas had been on furlough, which is 4 per cent and 5 per cent of total employments, respectively.
8. Incidences of COVID-19
Over the 7 days to 17th September there was a rate of 234 new cases per 100,000 population in predominantly rural areas, compared with 244 new cases per 100,000 population in predominantly urban areas (excl. London).
This represents a 13 per cent increase in the week-on-week weekly case rate in predominantly rural areas, compared with a 16 per cent increase in predominantly urban areas (excl. London).
Total number of lab confirmed cases in the last 7 days to 17th Sept, in England, by Local Authority Area classification
| Type of Local Authority area | Cases | Cases per 100,000 population |
|---|---|---|
| Predominantly rural | 28,418 | 234.1 |
| Urban with significant rural | 16,859 | 242.9 |
| Predominantly urban (excl. London) | 68,858 | 243.8 |
| London | 14,446 | 161.2 |
| England | 129,359 | 229.8 |
Weekly rolling total of new cases, per 100,000 population, up to 17th September 2021

Weekly rolling total of new cases of Covid-19, per 100,000 population, up to 17th September.
Weekly rolling total of new cases, per 100,000 population, 17th June to 17th September, 2021

Weekly rolling total of new cases of Covid-19, per 100,000 population, between 17th June to 17th September.
Section notes:
Source: Public Health England
Notes: Positive lab-confirmed cases are matched to area codes using the home postcode of the person tested. This is aggregated up to Local Authorities by PHE.
Limitations: 1) The aggregation of the data may be overstating the number of rural cases, 2) The testing rate is inconsistent across all regions, 3) Excess-death figures suggests there are undiagnosed cases of Covid-19.
9. The rural economy – context
This section covers a period prior to the COVID-19 outbreak
Predominantly rural areas contribute £261bn to the economy
11.7 million people live in local authorities regarded as predominantly rural area, 21% of England’s population.
These areas contribute £261bn (15.9%) to England’s economy.
Rural economies are as diverse as urban economies
85% of rural businesses are unrelated to agriculture, forestry or fishing.
Education, health and social work provide 17% of employment.
Wholesale and retail plus the repair of motor vehicles combined provide 13% of employment.
Manufacturing provides 11% of employment.
Small firms play a key role
½ m registered businesses (24% of England), employing 3.6 million (13% of England).
71% of employment in small and medium enterprises (41% in urban areas).
28% of employment in registered businesses with 1 to 9 employees (19% in urban areas).
18% of registered businesses have no employees (7% in urban areas).
It is estimated that in England there are an additional 2.7 million unregistered businesses i.e. those who are not registered for VAT and do not have employees registered for PAYE.
Tourism-related businesses are important
70,000 tourism-related businesses, employing 0.6 million people.
14% of employment (11% in urban areas)
In the more sparsely populated areas tourism becomes more important, providing 22% of employment.
10. Poverty in rural areas – context
This section covers a period prior to the COVID-19 outbreak
Poverty is more dispersed
For all principal measures of Households Below Average Income (households, working-age people, children and pensioners) there are proportionally fewer households in poverty than in urban areas.
However unlike in urban areas, where poverty can be concentrated in certain areas, in rural areas it tends to be more dispersed.
Index of Multiple Deprivation suggests deprivation is less prevalent but there are predominantly rural areas with high levels of deprivation
1 per cent of people living in rural areas are in areas that are within the most deprived 10 per cent of the Index of Multiple Deprivation.
At a local authority level there are predominantly rural areas with high levels of overall deprivation (see map) particularly in the North, East and South West.
The Index takes account of several factors affecting deprivation.
Levels of overall deprivation in predominantly rural Local Authority areas

Levels of overall deprivation in predominantly rural Local Authority areas
Housing is less affordable
In predominantly rural areas the average lower quartile house price was 8.8 times the average lower quartile earnings in 2018, compared with 7.5 times in predominantly urban areas (excluding London).
Lower average earnings for those working in rural areas
Average earnings for those living in rural areas is higher than for those living in urban areas.
However, for those working in rural areas average earnings are lower.
11. Further information
Some figures are liable to revision in subsequent quarters and so comparisons with previous bulletins should be treated with caution. This is particularly the case for house prices, for which previous quarters may be revised significantly.
Areas forming settlements with populations of over 10,000 are urban, while the remainder are defined as rural town and fringe; village; or hamlet and isolated dwellings.
For more information about the 2011 Rural-Urban Classification please visit the Rural Urban Classification webpage.
Produced by Defra Rural Statistics:
rural.statistics@defra.gsi.gov.uk
Comm