Annual UK VAT Statistics 2020 to 2021 Commentary
Updated 14 December 2021

© Crown copyright 2021
This publication is licensed under the terms of the Open Government Licence v3.0 except where otherwise stated. To view this licence, visit nationalarchives.gov.uk/doc/open-government-licence/version/3 or write to the Information Policy Team, The National Archives, Kew, London TW9 4DU, or email: psi@nationalarchives.gov.uk.
Where we have identified any third party copyright information you will need to obtain permission from the copyright holders concerned.
This publication is available at https://www.gov.uk/government/statistics/value-added-tax-vat-annual-statistics/annual-uk-vat-statistics-2020-to-2021-commentary
About this release
This official statistics publication provides information on VAT receipts, Home VAT and Import VAT. It includes Home VAT declared on traders’ returns classified by sector and trade group, VAT registrations, de-registrations and trader population. It also contains a historic series of annual and monthly VAT receipts and VAT registrations and de-registrations.
The Annual UK VAT Statistics publication is produced by the Indirect Tax Customs and Coordination team. For statistical questions, email revenuemonitoring@hmrc.gov.uk.
Coronavirus (COVID-19) VAT deferrals
To help businesses manage cash flow during the COVID-19 pandemic, VAT traders have been able to defer Home VAT payments due between 20 March 2020 and 30 June 2020. Businesses were able to either:
- pay in full by 31 March 2021
- join the online VAT deferral new payment scheme by 21 June 2021 to spread payments of deferred VAT over smaller, interest free instalments
- contact HMRC to make an arrangement to pay by 30 June 2021
Headlines
Total VAT receipts in the tax year ending March 2021 decreased by 22% from the previous tax year. There was a downward impact on receipts from the VAT deferral measure which took effect from 20 March 2020.
The Wholesale and Retail sector continued to be the largest contributor to net Home VAT liabilities.
68% of total net Home VAT declared was paid by traders with an annual turnover greater than £10 million.
Chart 1: Net Home VAT and Import VAT receipts for this year and the last 10 tax years

For the full dataset that accompanies Chart 1 go to Annual UK VAT Statistics 2020 to 2021 Tables.
Chart 1 demonstrates the following trends for Home VAT and Import VAT receipts:
-
in tax year 2020 to 2021, Home VAT decreased by £24.1 billion and Import VAT decreased by £4.2 billion, with a downward impact on Home VAT from the VAT deferral measure
-
Import VAT receipts was £4.2 billion (13%) lower for the tax year ending March 2021 compared to tax year ending March 2020. This is mainly due to postponed VAT accounting (PVA). Since January 2021, traders have been able to include Import VAT on their regular VAT return
Net Home VAT means VAT declared on VAT returns. From 1 January 2021 this includes import VAT paid through PVA.
Payments made using PVA are recorded under Home VAT payments and not Import VAT. Only traders who are continuing to pay Import VAT under the previous regime are contributing to Import VAT receipts as reported above.
VAT population and taxable turnover
Background
VAT is charged when a VAT-registered business sells to either another business or to a non-business customer. When VAT-registered businesses buy goods or services they can generally reclaim the VAT they have paid.
Rates
There are 3 rates of VAT, depending on the goods or services the business provides. The rates are:
- standard: 20%
- reduced: 5%
- zero: 0%
There are also some goods and services that are
- exempt from VAT
- outside the UK VAT system altogether
For further information, please go to VAT rates.
Chart 2: Proportion of VAT population and annual taxable turnover by type of business for the tax year ending March 2021.
Incorporated companies lead in both population size and taxable turnover in the tax year ending March 2021.

For the full dataset that accompanies Chart 2 go to Annual UK VAT Statistics 2020 to 2021 Tables.
Chart 2 shows the following trends for VAT population and taxable turnover:
-
incorporated companies accounted for the largest share of the VAT population and annual taxable turnover
-
this group accounted for 73% of traders, and 92% of annual taxable turnover in the tax year ending March 2021
-
sole proprietors were the second largest group in terms of VAT population; this group accounted for 16% of VAT traders. However, the annual taxable turnover declared by this group only accounted for less than 1% of the total for the tax year ending March 2021
VAT population by trade sector
Trade sectors
The trade sector is recorded using the United Kingdom Standard Industrial Classification of Economic Activities (SIC), a classification of the type of economic activity in which an entity is engaged. The trade class for each trader is related to the sector of the economy in which the trader’s main economic activity occurs; hence the VAT population SIC breakdown cannot be taken as the exact economic activity of each trade sector.
Chart 3: Contribution to net Home VAT liabilities from the top 10 trade sectors.
The Wholesale and Retail sector remains the largest sector in the tax year ending March 2021.

For the full dataset that accompanies Chart 3 go to Annual UK VAT Statistics 2020 to 2021 Tables.
Chart 3 shows the following trends in net Home VAT liabilities from the top 10 trade sectors:
-
the Wholesale and Retail sector was the largest in terms of contribution to VAT liabilities. Net Home VAT liabilities were £29 billion, equating to 30% of the total for the tax year ending March 2021
-
the Financial and Insurance Activities sector and Other Service Activities sector have replaced the Arts, Entertainment and Recreation sector and Accommodation and Food Services sector in the top 10 trade sectors from the previous year
Chart 4: Scatter plot showing year-on-year percentage against year-on-year-actual change (£million) of the top 10 contributing sectors for the tax year ending March 2021.
Out of the top contributing sectors, all have seen decreases from the tax year ending March 2020 except for the Wholesale Retail sector, Professional, Scientific and Technical Activities sector and Construction sector.

For the full dataset that accompanies Chart 4 go to Annual UK VAT Statistics 2020 to 2021 Tables.
Chart 4 shows the following trends in changes net Home VAT liabilities from the top 10 trade sectors compared to the previous tax year:
-
the Construction sector increased by £650 million (12%), the largest year-on-year change. The only other sectors to see increases were Wholesale and Retail sectors which increased by £30 million (2%) and Professional, Scientific and technical activities which increased by £19 million (2%).
-
of the top contributing sectors, the Financial and Insurance Activities sector saw the largest decrease of £560 million (25%)
VAT population and net Home VAT by turnover
Chart 5: VAT population by annual turnover bands for the tax year ending March 2021
Traders with £1 turnover up to threshold led with the largest number of traders.
The sum of the percentages below does not equal 100%, as the percentage of traders by turnover band is calculated using the total number of traders. This total number also includes traders where the turnover band is ‘Unknown’, which are not included in chart above, but account for 4% of traders.

For the full dataset that accompanies Chart 5 go to Annual UK VAT Statistics 2020 to 2021 Tables.
Chart 5 shows the following trend in trader population across annual turnover band:
- 52% of traders declared annual turnover below the VAT registration threshold (inclusive)
Chart 6: Net Home VAT by annual turnover bands for the tax year ending March 2021.
Traders with a turnover greater than £10 million led in net Home VAT in the tax year ending March 2021.

For the full dataset that accompanies Chart 6 go to Annual UK VAT Statistics 2020 to 2021 Tables.
Chart 6 shows the following trend in Net Home VAT declared across annual turnover band:
- traders with an annual turnover greater than £10 million declared £67 billion in net Home VAT, 68% of the total for the tax year ending March 2021. This group only accounted for 1% of traders (see chart 5)
Payments and repayments
Payment position
Home VAT payment traders are defined as those VAT registered businesses that are VAT payers, which means their net VAT is positive across the tax year. Conversely, Home VAT repayment traders are defined as those VAT registered businesses that are VAT re-payers, which their net VAT is negative across the tax year.
Chart 7: Proportion of traders in net payment and net repayment positions for the tax year ending March 2021.

For the full dataset that accompanies Chart 7 go to Annual UK VAT Statistics 2020 to 2021 Tables.
Chart 7 shows the following trends in the proportion of traders in net payment and net repayment positions:
-
over 70% of traders (1,424,510) were in a net payment position and 582,170 traders were in a net repayment position in the tax year ending March 2021
-
net payment traders decreased by 6%, and net repayment traders increased by 19% compared with the previous tax year
Chart 8: Net Home VAT payments declared by VAT payers, by payment size for the tax year ending March 2021.
More than half of net Home VAT payments are accounted for by traders in the top 0.5% in the tax year ending March 2021.

For the full dataset that accompanies Chart 8 go to Annual UK VAT Statistics 2020 to 2021 Tables.
Chart 8 shows the following trends in net payments declared by payment size:
-
total net Home VAT payments declared by VAT payers were £167 billion in the tax year ending March 2021
-
the top 20% accounted for £155 billion (93%) of this total; the top 0.01% accounted for £39 billion (24%)
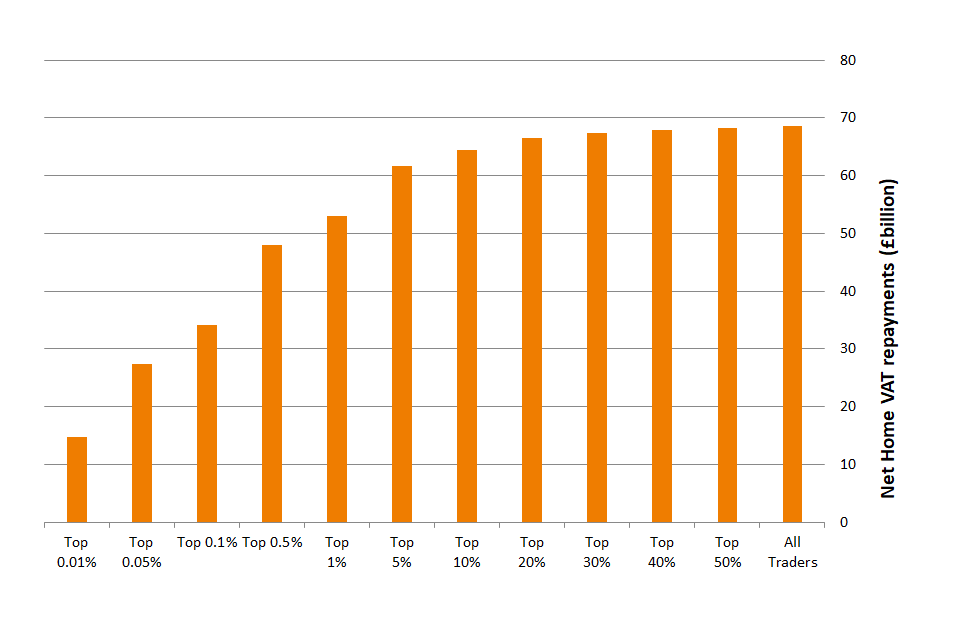
Chart 9: Net Home VAT repayments declared by VAT re-payers, by repayment size tax year ending March 2021.
Distribution of net Home VAT repayments remains similar to the tax year ending March 2020.
For the full dataset that accompanies Chart 9 go to Annual UK VAT Statistics 2020 to 2021 Tables.
Chart 9 shows the following trends in net re-payments declared by payment size:
-
total net Home VAT repayments declared by VAT re-payers were £68.5 billion in the tax year ending March 2021
-
the top 20% accounted for £66.5 billion (97%) of this total; the top 0.01% accounted for £15 billion (21%)
VAT population changes
Chart 10: Registrations and de-registrations of traders from the tax year ending 2011 to the tax year ending March 2020.
New registrations increased in the tax year ending March 2021 after decreasing in the tax year ending March 2020. De-registrations continue to decrease in the tax year ending March 2021.

For the full dataset that accompanies Chart 10 go to Annual UK VAT Statistics 2020 to 2021 Tables.
Chart 10 shows the following trends in number of registrations and de-registrations:
-
new registrations increased steadily from the tax year ending March 2013 to the tax year ending March 2017 where it decreased by 33,666 (8%). Since the tax year ending March 2018, there has been an upward trend in new registrations
-
de-registrations were below 200,000 a year from the tax year ending March 2014 to the tax year ending March 2016, but increased above that level in the tax year ending March 2017, increasing further in the tax year ending March 2018. This increase in de-registrations was likely to be linked to policy changes in relation to the Flat Rate Scheme (see below)
The freeze in the VAT registration and deregistration thresholds has increased the number of registrations and decreased the number of deregistrations progressively from the year ending March 2019.
VAT Flat Rate Schemes
The VAT Flat Rate Scheme (FRS) was introduced in 2002 to simplify VAT for businesses with an annual turnover up to £150,000, tax exclusive. For further information, please go to VAT rates.
Chart 11: Number of Flat Rate Scheme (FRS) traders over the last 10 years.
The number of Flat Rate Scheme traders decreased in the tax year ending March 2021.

For the full dataset that accompanies Chart 11 go to Annual UK VAT Statistics 2020 to 2021 Tables.
Chart 11 show the following trends in the number of FRS traders:
-
the number of FRS traders doubled between the tax year ending March 2012 and the tax year ending March 2016
-
as mentioned above, the decrease in the number of FRS traders between the tax year ending March 2016 and the tax year ending March 2021 is likely to be linked to policy changes in relation to the scheme.